

An analytics dashboard provides businesses and data professionals with real-time, visual insights into their performance metrics. These dashboards consolidate complex data into easy-to-understand visuals, enabling better decision-making, faster responses, and more efficient operations. Dashboards offer a clear and immediate view of the health of your business by tracking website traffic, sales trends, and/or customer behavior. Businesses that leverage these tools effectively can transform raw data into actionable strategies.
Americaneagle.com is a trusted leader in analytics and cutting-edge digital solutions. With extensive expertise in harnessing the power of analytics dashboards, Americaneagle.com helps organizations unlock the potential of their data to make smarter, faster decisions. In this blog, we’ll explore the different types of dashboards, their practical applications, and how insights from tools like Google Analytics can help. Whether you're a seasoned data professional or new to the world of dashboards, we’ll provide valuable knowledge to empower your strategies.
What is an Analytics Dashboard?
An analytics dashboard is a tool that collects, organizes, and visually represents complex data in a way that’s easy to understand. By turning raw, often overwhelming datasets into clear charts, graphs, and summaries, these dashboards simplify analysis and highlight the most important metrics. Businesses rely on them to monitor performance in real-time, track key metrics like sales numbers, customer behavior, or marketing ROI, and identify trends or areas for improvement. With everything displayed in one intuitive interface, analytics dashboards help organizations to make informed, data-driven decisions quickly and confidently, driving better strategies and outcomes.
Types of Analytics Dashboards
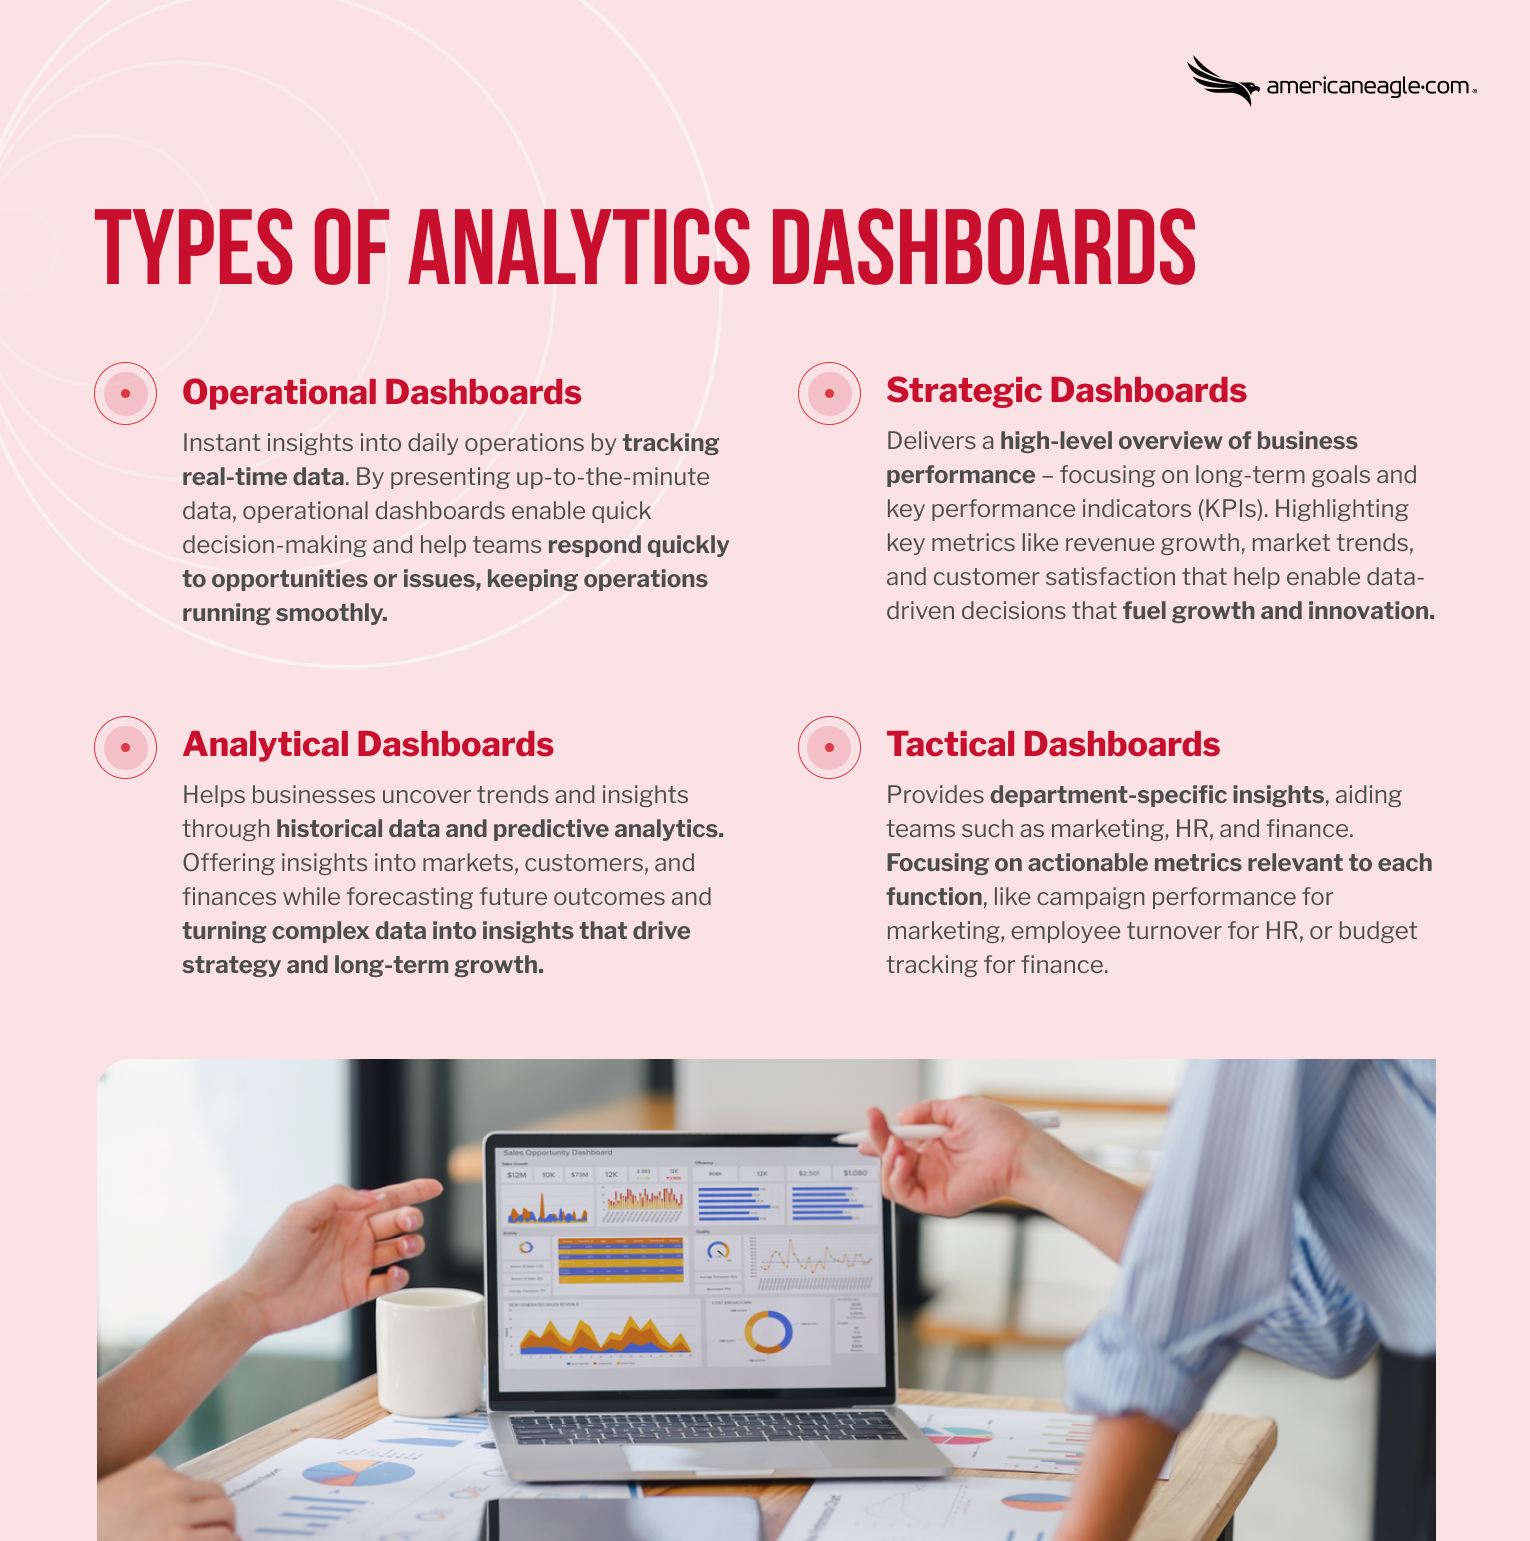
Different types of analytics dashboards serve various purposes. Below are the most common ones:
Operational Dashboards
An operational dashboard gives businesses instant insights into their daily operations by tracking real-time data. These dashboards focus on key performance metrics like sales trends, website traffic, or inventory levels, allowing organizations to monitor activity as it happens. Common use cases include tracking ecommerce transactions, live website visits, or production workflows. By presenting up-to-the-minute data, operational dashboards enable quick decision-making and help teams respond quickly to emerging opportunities or issues, keeping operations running smoothly.
Strategic Dashboards
A strategic dashboard is a type of dashboard that delivers a high-level overview of business performance, specifically focusing on long-term goals and key performance indicators (KPIs). These dashboards showcase critical metrics such as revenue growth, market trends, and customer satisfaction, offering executives and high-level decision-makers the insights they need to align strategies with organizational objectives. By presenting a clear snapshot of progress toward key goals, strategic dashboards allow businesses to make data-driven decisions that drive growth and innovation.
Analytical Dashboards
An analytical dashboard is a comprehensive tool enabling businesses to analyze in-depth data and uncover trends, patterns, and insights over time. These dashboards focus on historical data and predictive analytics, helping organizations make informed, data-driven decisions. Whether used for market analysis to identify emerging opportunities, understand customer behavior, or assess financial performance, analytical dashboards provide the context needed to forecast future outcomes. By transforming complex datasets into actionable insights, they support strategic planning and long-term business growth.
Tactical Dashboards
A tactical dashboard provides department-specific insights, aiding teams in areas such as marketing, HR, and finance. These dashboards focus on actionable metrics relevant to each function, like campaign performance for marketing, employee turnover for HR, or budget tracking for finance. For example, a marketing tactical dashboard might highlight data on lead generation and conversion rates, while a finance dashboard could display expenditure trends and cash flow management.
Google Analytics Dashboards: Key Features and Use Cases
Google Analytics dashboards are a powerful tool for monitoring and analyzing website performance, giving businesses a clear view of critical metrics - all in one place. These customizable dashboards allow users to tailor reports to fit their specific needs by choosing relevant data widgets and displaying key metrics like traffic sources, user behavior, and conversions. With drag-and-drop functionality, users can easily create dashboards that provide a comprehensive snapshot of performance, saving time and improving efficiency in data tracking.
To maximize the value of a Google Analytics dashboard, it’s important to focus on actionable insights. Best practices include grouping related metrics for better context, such as pairing traffic source data with conversion rates to understand marketing effectiveness. Regularly updating dashboards to reflect new goals or campaigns ensures they remain relevant. Breaking down user behavior data, like session duration and bounce rates, helps identify areas for website improvement.
Examples of Analytics Dashboards
Analytics dashboards play a key role in transforming raw data into actionable insights, with tools like Google Analytics, Klipfolio, Tableau, and Power BI leading the way in diverse applications. For example:
- Google Analytics provides businesses with website performance tracking by monitoring visitor behavior, traffic sources, and conversions.
- Looker, part of Google Cloud Platform, is a modern business intelligence (BI) and data analytics platform, while Looker Studio (formerly Google Data Studio), is a free data visualization and reporting tool.
- Klipfolio excels in real-time data monitoring, making it ideal for sales or social media performance tracking.
- Tableau's strength lies in its advanced visualization capabilities for uncovering complex trends.
- Power BI integrates seamlessly with other Microsoft products, aiding in financial and operational analysis.
By leveraging these analytics dashboard examples, organizations across industries can make data-driven decisions that enhance marketing, operations, and strategic outcomes.
How to Choose the Right Analytics Dashboard
Selecting the right analytics dashboard depends on business needs and goals. Factors to consider include data sources, usability, and customization. You should also compare different analytics dashboard tools and choose the best one based on your company size and industry.

Conclusion: Making the Most of Analytics Dashboards
Analytics dashboards are valuable tools for turning raw data into meaningful insights, allowing businesses to make informed decisions and achieve their goals. By understanding the different types of dashboards and selecting one that aligns with your needs, you can unlock new opportunities for growth and efficiency. Whether you're tracking website performance, monitoring sales, or analyzing customer behavior, the right analytics dashboard ensures your team has access to actionable data tailored to your objectives.
To maximize the benefits of dashboards, partnering with experts like Americaneagle.com can make all the difference. With our proven track record in delivering effective analytics solutions, we can help you implement a customized strategy that drives results. Businesses are encouraged to explore various types of dashboards to continually evolve their data strategies and stay ahead in competitive markets. For tailored guidance and support in leveraging analytics dashboards, contact Americaneagle.com and take the first step toward smarter, data-driven decision-making.
Related FAQs:
What is the difference between operational and strategic dashboards?
Operational dashboards focus on daily processes and immediate metrics, while strategic dashboards provide a high-level view of long-term goals and performance trends.
How do Google Analytics dashboards help with website performance tracking?
Google Analytics dashboards track website performance by monitoring traffic sources, user behavior, and real-time conversion rates.
What are the best free tools for creating analytics dashboards?
Some of the best free tools for creating analytics dashboards include Google Analytics, Looker, Microsoft Power BI (free version), and Databox.
How often should businesses update their analytics dashboards?
Businesses should update their analytics dashboards as often as new data becomes available, ideally daily or weekly, depending on the insights needed.
Can an analytics dashboard integrate with other software tools?
Yes, most analytics dashboards can integrate with other software tools like CRM platforms, data warehouses, and marketing automation systems for a seamless data flow.